Gallery of Charts
Below is a gallery of example charts for different types of charts and maps. Currently, all examples derive from the RICK module (source code rick.py) to be used straight out of the box (with some customization possible).
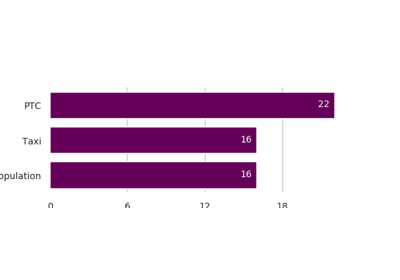
Bar Charts
Below is a gallery of bar charts.
RICK Bar Chart: derives from the RICK package with source code in rick.py.
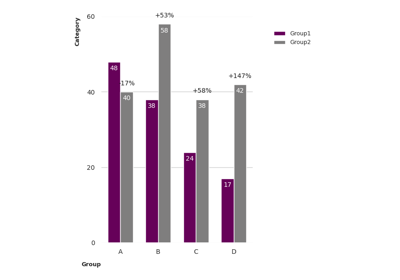
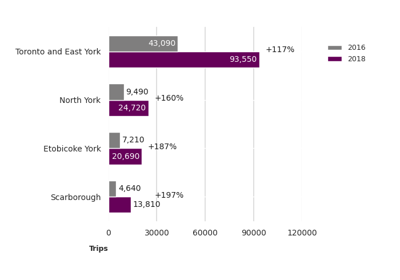
Grouped Bar Charts
Below is a gallery of grouped bar charts.
RICK Vertical Grouped Bar Chart: derives from the RICK package with source code in rick.py.
RICK Horizontal Grouped Bar Chart: derives from the RICK package with source code in rick.py.
Line Charts
Below is a gallery of line charts.
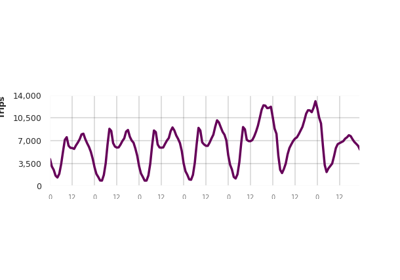
RICK Time-of-Week Line Chart: derives from the RICK package with source code in rick.py.
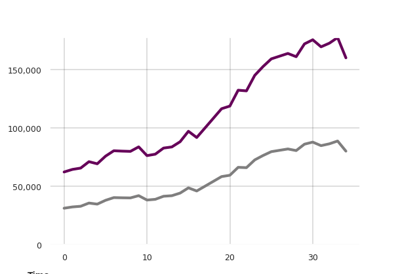
RICK Line Chart: derives from the RICK package with source code in rick.py.
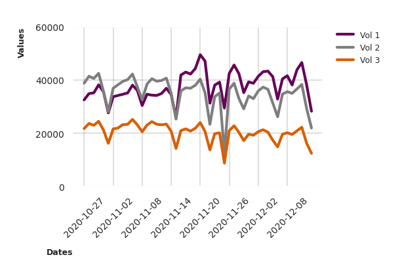
Mulit-line Chart: derives from the RICK package with source code in rick.py.
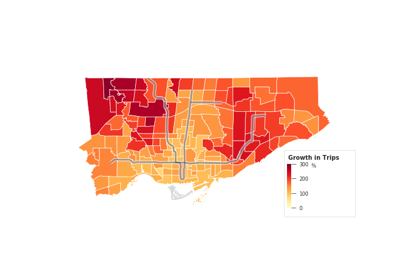
Maps
Below is a gallery of various types of maps.
RICK Choropleth Map: derives from the RICK package with source code in rick.py.