Note
Click here to download the full example code
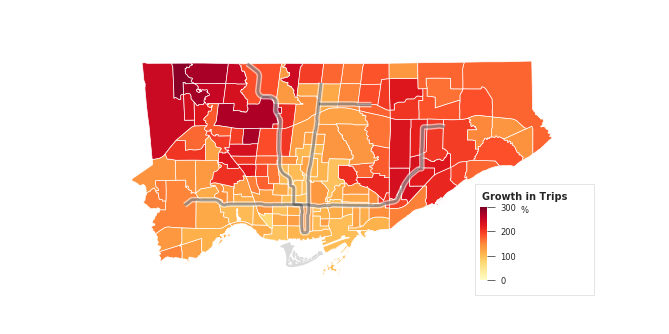
RICK Choropleth Map
Example chloropleth map.
from sqlalchemy import create_engine
import matplotlib.pyplot as plt
import matplotlib as mpl
import pandas as pd
import configparser
from psycopg2 import connect
import psycopg2.sql as pg
import pandas.io.sql as pandasql
import numpy as np
import datetime
import math
import rick
import geopandas as gpd
import os
import shapely
from shapely.geometry import Point
os.environ["PROJ_LIB"]=r"C:\Users\rliu4\AppData\Local\Continuum\anaconda3\Library\share"
import importlib
import matplotlib.ticker as ticker
import matplotlib.font_manager as font_manager

CONFIG = configparser.ConfigParser()
# CONFIG.read(r'C:\Users\rliu4\Documents\Python\config.cfg')
CONFIG.read(r'/home/cnangini/db.cfg')
dbset = CONFIG['DBSETTINGS']
con = connect(**dbset)
Data Collection
This Section grabs and formats the data.
query = '''

WITH sum AS (
SELECT extract(month from pickup_datetime) as mon, extract(year from pickup_datetime) as yr, extract(week from pickup_datetime) as wk, pickup_neighbourhood,
sum(count) as count  FROM ptc.trip_data_agg_neighbourhood
GROUP BY   pickup_datetime, pickup_neighbourhood

), ward1 AS  (

SELECT  avg(count) as count, pickup_neighbourhood from sum
WHERE (yr=2018 AND mon IN (9))
GROUP BY pickup_neighbourhood
ORDER BY count
), ward2 AS  (

SELECT avg(count) as count, pickup_neighbourhood from sum
WHERE (yr=2016 AND mon IN (10))
GROUP BY pickup_neighbourhood
ORDER BY count
)

SELECT pickup_neighbourhood,  geom, (b.count - a.count)/(a.count)*100 as growth FROM ward2 a
LEFT JOIN ward1 b USING ( pickup_neighbourhood)
LEFT JOIN gis.neighbourhood ON area_s_cd::integer=pickup_neighbourhood

'''
Rotates data 17 degrees to orient Toronto perpendicularly
data = gpd.GeoDataFrame.from_postgis(query, con, geom_col='geom')
# data = data.to_crs({'init' :'epsg:3857'})
data = data.to_crs(epsg=3857)

## Below doesn't work because one row is MULTIPOLYGON and the
## other rows are POLYGON
# for index, row in data.iterrows():
#     rotated = shapely.affinity.rotate(row['geom'], angle=-17, origin = Point(0, 0))
#     data.at[index, 'geom'] = rotated
data['geom']=data['geom'].apply(lambda x: shapely.affinity.rotate(x, angle=-17, origin = Point(0, 0)))
The function only needs these columns, in this order
data=data[['geom', 'growth']]
Calls the Function
fig, ax = rick.charts.chloro_map(con, data, subway = True, lower = 0, upper = 300, title = 'Growth in Trips',
                                       island = False,  unit = '%', nbins = 3)
Out:
/etc/jupyterhub/.venv/lib/python3.5/site-packages/pyproj/crs/crs.py:53: FutureWarning: '+init=<authority>:<code>' syntax is deprecated. '<authority>:<code>' is the preferred initialization method. When making the change, be mindful of axis order changes: https://pyproj4.github.io/pyproj/stable/gotchas.html#axis-order-changes-in-proj-6
  return _prepare_from_string(" ".join(pjargs))
Total running time of the script: ( 0 minutes 4.183 seconds)