Note
Go to the end to download the full example code
RICK Vertical Grouped Bar Chart
Example of a vertical grouped bar chart.
import numpy as np
import matplotlib.pyplot as plt
import pandas as pd
import rick
Data Collection
This Section grabs and formats the data.
np.random.seed(42)
data = {
    'Category': ['A', 'B', 'C', 'D'],
    'Group1': np.random.randint(10, 50, 4),
    'Group2': np.random.randint(20, 60, 4)
}
df = pd.DataFrame(data)
df = df.set_index('Category')
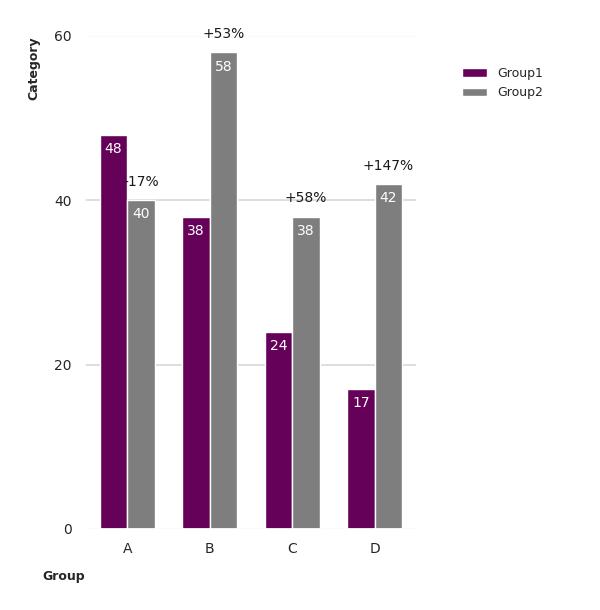
Vertical Grouped Bar Chart
This Section uses the new vertical grouped bar chart function.
fig, ax = rick.charts.vertical_grouped_bar_chart(
    data=df,
    precision=1,
    xlab='Group',
    ylab='Category',
    percent=True,
    legend=['Group1', 'Group2'])
plt.tight_layout()
plt.show()
Total running time of the script: (0 minutes 1.423 seconds)